DebugView is a diagnostic feature in Google Analytics 4 that shows incoming events from a single device or browser in near real time. It is primarily used to validate tracking implementations and confirm that events, parameters, and user properties are sent correctly before relying on GA4 reports.
Unlike standard GA4 reports, DebugView focuses on individual debug sessions rather than aggregated traffic. This makes it suitable for testing configurations, Google Tag Manager changes, and e-commerce tracking.
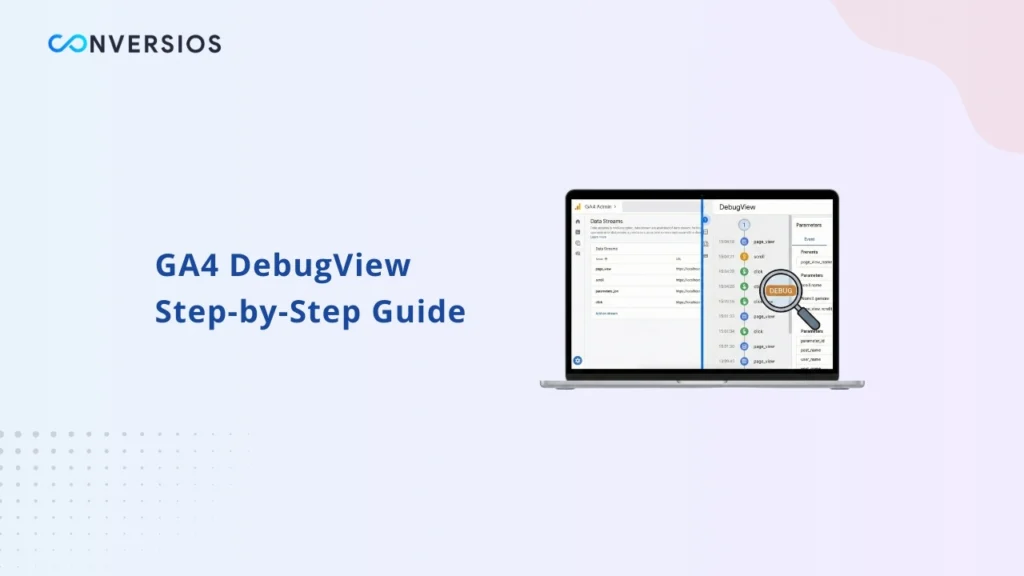
Step-by-Step Guide: How to Use DebugView in GA4
Step 1: Open DebugView in GA4
- Log in to Google Analytics
- Open your GA4 property
- Click Admin
- Under Data display, select DebugView
At this stage, DebugView may be empty. This is normal if debug mode is not enabled yet.
Step 2: Enable Debug Mode
Choose one of the methods below.
Option A: Google Tag Manager Preview (Recommended)
- Open Google Tag Manager
- Click Preview
- Enter your website URL
- Visit your site in preview mode
GA4 automatically marks this visit as a debug session.
Option B: Google Analytics Debugger Extension
- Install the Google Analytics Debugger Chrome extension
- Turn it ON
- Refresh your website
Your browser session will now appear in DebugView.
Step 3: Trigger Events on Your Website
Now perform actions on your site, such as:
- Open a product page
- Click Add to Cart
- Start checkout
- Complete a test purchase
These actions send events to GA4.
Step 4: Check Events in DebugView
Return to DebugView and look at the timeline.
- New events should appear within a few seconds
- Click any event to see its details
- Check event names and values
If events do not appear, debug mode is not active.
Step 5: Review Event Details
Click an event and check:
- Event name (for example: add_to_cart or purchase)
- Price and currency
- Product ID and name
- Transaction ID for purchases
Incorrect or missing values here will cause reporting problems later.
Step 6: Confirm Conversions
If you have marked events as conversions:
- Look for the conversion indicator in DebugView
- If it is missing, review conversion settings in GA4
Step 7: Finish Testing
Once testing is complete:
- Close GTM Preview mode
- Turn off the Debugger extension
DebugView will stop showing events from your session.
What DebugView Shows in GA4
DebugView displays raw event data shortly after it is sent to GA4. Each event can be inspected to verify:
- Event name
- Timestamp
- Event parameters
- User properties
Because DebugView shows data before it is processed into reports, it is useful for identifying issues such as missing parameters, incorrect naming, or unexpected values.
How Debug Mode Works
DebugView only displays data from sessions that are marked as debug sessions. GA4 identifies debug sessions based on how events are sent.
There are several ways to enable debug mode, depending on how GA4 is implemented.
Understanding the DebugView Interface
DebugView is organized around a time-based event stream.
The Seconds stream shows events received during the last 60 seconds.
The Minutes stream shows activity from the last 30 minutes.
Selecting an event reveals its details.
Event Details
Each event entry includes:
- Event name
- Timestamp
- Parameters sent with the event
- User properties active at the time
Reviewing these fields helps identify issues such as missing parameters or incorrect values.
Conversion Events
Events marked as conversions in GA4 are visually indicated in DebugView.
If a conversion indicator does not appear, the conversion configuration should be reviewed in the GA4 interface.
Using DebugView for Ecommerce Tracking
DebugView is frequently used to validate ecommerce implementations before changes are released.
Common ecommerce events reviewed include:
- view_item
- add_to_cart
- begin_checkout
- add_payment_info
- purchase
For each event, parameters such as value, currency, transaction_id, and the items array should be reviewed.
The items array should contain item identifiers, names, prices, and quantities. Missing or incorrectly structured parameters can result in inaccurate or incomplete revenue data in GA4 reports.
When DebugView Does Not Show Data
If no events appear in DebugView, several conditions should be checked when GA4 not showing data issues occur.
– Debug mode is not enabled for the current session
– Consent settings are blocking analytics events
– Browser tracking protection or extensions are blocking requests
– Events are sent to a different GA4 property or data stream
– Events appear with a short delay
Limitations of DebugView
DebugView is designed for debugging individual sessions and is not intended for historical analysis or traffic monitoring.
It does not show aggregated data and only displays events from devices or browsers where debug mode is enabled. Once the session ends or debug mode is disabled, events stop appearing.
Debugging Considerations
DebugView is most effective when used in a controlled testing environment.
Testing from a clean browser session reduces interference from cached data or extensions. Desktop and mobile behavior can differ and should be reviewed independently when validating tracking changes.
After updates to GTM containers or tracking code, DebugView should be checked again to confirm expected behavior.
Conclusion
DebugView is a core diagnostic tool in Google Analytics 4. It provides visibility into how events and parameters are sent to GA4 and allows tracking issues to be identified before they affect reporting.
For teams working with GA4, Google Tag Manager, or ecommerce tracking, DebugView is an essential part of validating implementations and maintaining data accuracy.
Frequently Asked Questions
Q. Is DebugView the same as the Realtime report?
No. DebugView displays raw debug data from specific sessions, while the Realtime report shows processed data across users.
Q. Does DebugView data affect GA4 reports?
No. DebugView data is not included in standard GA4 reporting.
Q. How long does DebugView retain data?
DebugView displays activity from approximately the last 30 minutes.